
Figure Technology Solutions: The Mispriced Compounder
The cheapest thing about Figure is its share price

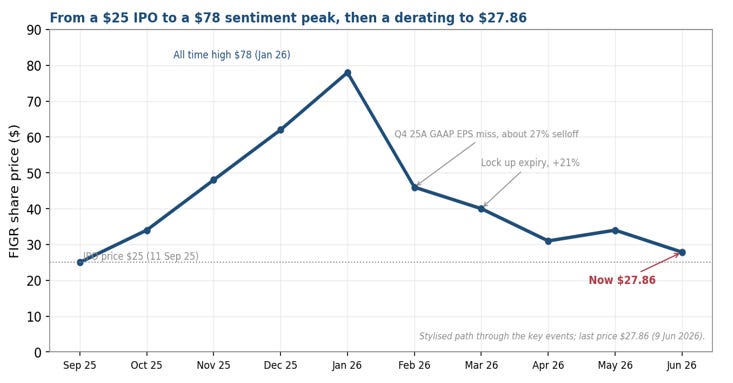
We are long Figure Technology Solutions (NASDAQ: FIGR), a roughly $6.2bn fintech that runs the largest nonbank home equity lending marketplace in the United States, settled on its own public blockchain. The shares peaked near $78 in January 2026 and trade at $27.86 today, 9 June 2026. The decline tracked three things: the unwind of a broad crypto sentiment rally that had lifted the stock well above its IPO price, a single quarter in which GAAP earnings fell short of consensus on items below the operating line, and an April short seller report. The operating business did not slow during any of these; on the published data it continued to grow.
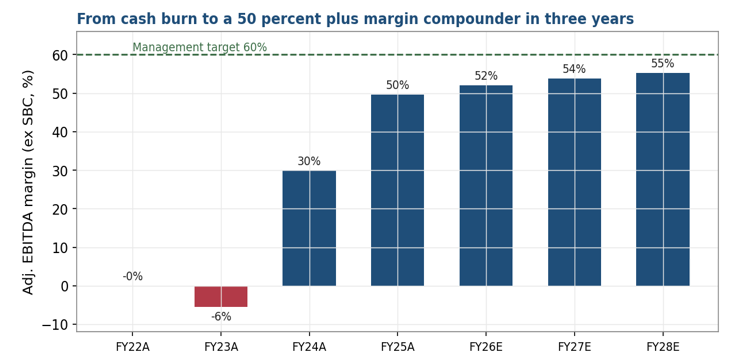
Across the de-rating the fundamentals improved. Adjusted net revenue grew 49% in FY25A and 92% in Q1’26A. Consumer loan marketplace volume reached a record $2.9bn in Q1’26A, up 113% YoY, and exceeded $1.4bn in the single month of May, up 135%. The adjusted EBITDA margin reached 50%, up 17 points YoY, and management guides to second quarter volume of $3.8 to 4.1bn and a medium term margin of 60%. The most recent reported quarter and the most recent monthly data point are the strongest in the company’s history.
Figure’s advantage is its cost to manufacture a loan. Because underwriting, lien and note registration, custody and settlement run on the Provenance blockchain, the marginal cost of clearing a loan is a fraction of the conventional stack. That cost position funds an approximately 4% take rate, a margin above 50%, and the capacity to share economics with 380 plus origination partners while still operating at a lower unit cost than competitors on conventional rails. This cost position is the most defensible feature of the business and the part the market is presently discounting.
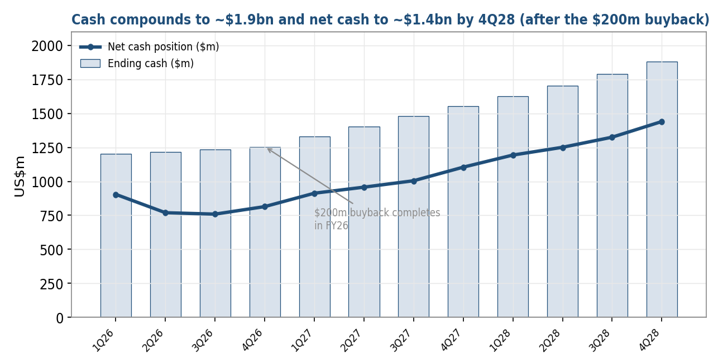
The balance sheet removes the usual reasons a high growth lender derates. Figure is GAAP profitable, held $1.5bn of cash at the end of Q1’26A against modest recourse debt, carries net cash of roughly $0.9bn, and is repurchasing stock under a $200m authorisation. The IPO lock up expired in March; the shares rose 21% that day. Our quarterly model shows net cash compounding toward $1.4bn, and ending cash toward $1.9bn, by the end of FY28E.
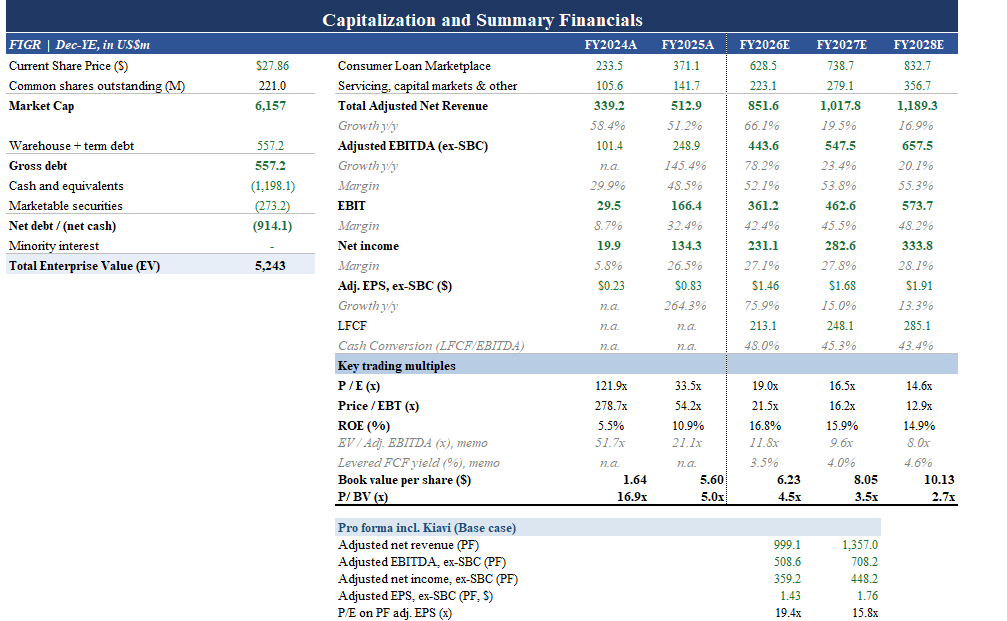
At $27.86 the market pays 19x adjusted EPS on CY26E and 14.6x on CY28E, and 11.8x EV/CY26E EBITDA falling to 8.0x on CY28E, a discount to slower, lower margin fintech peers and to the most bullish published analyst research. A reverse DCF shows the price embeds a sharp deceleration that the live data contradicts. We set fair value at $53, about 92% above the current price, on fwd P/E and price to EBT, with an 8 year DCF as a cross check. This is our base case for the combined company following the Kiavi acquisition, which we consolidate from close, as does the bull case; the downside instead assumes the deal does not complete and operations weaken, at about $35, still above the price, while Figure standalone on in line operations is worth about $44. The stablecoin, tokenization and digital asset businesses carry no value in our base case and represent additional, unpriced optionality.
Thesis in Brief
Figure Technology Solutions is the largest non bank home equity lending marketplace in the United States, and the only listed company that originates, registers, settles, services and trades loans on its own public blockchain. That architecture lets it manufacture a loan for a fraction of the conventional cost, which funds a take rate near 4 percent, an adjusted EBITDA margin near 50%, and a ROE above 20 percent.
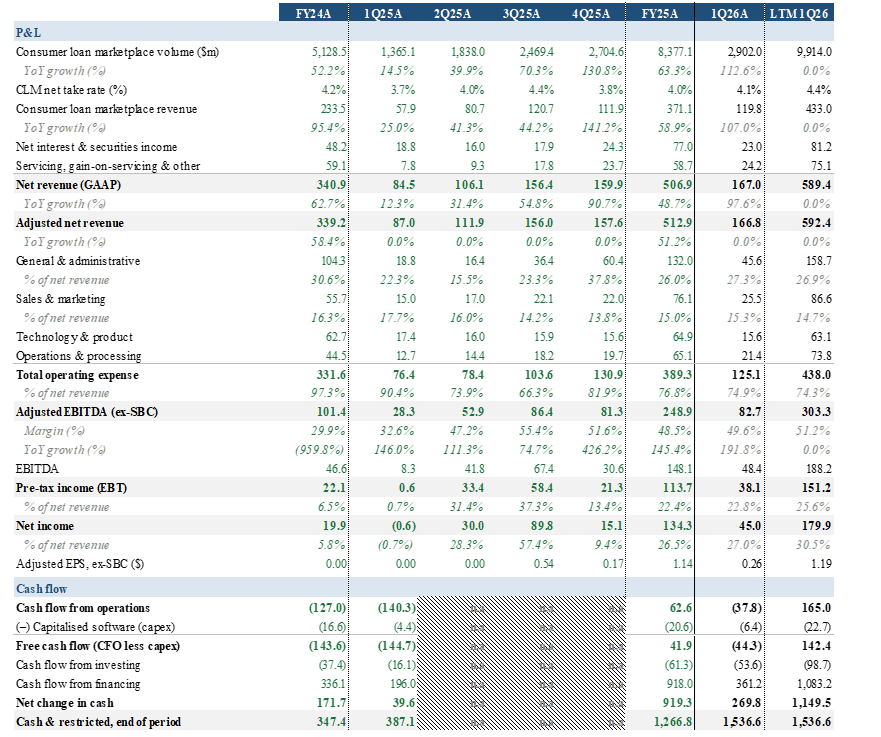
The operating record is accelerating. In Q1’26A adjusted net revenue grew 92 percent to $167m, adjusted EBITDA reached $83m at a 49.6 percent margin, and consumer loan marketplace volume rose 113 percent to a record $2.9bn. May 2026 volume of $1.4bn was up 135 percent, and management guides Q2’26E volume to $3.8bn to $4.1bn and a medium term margin of 60 percent.
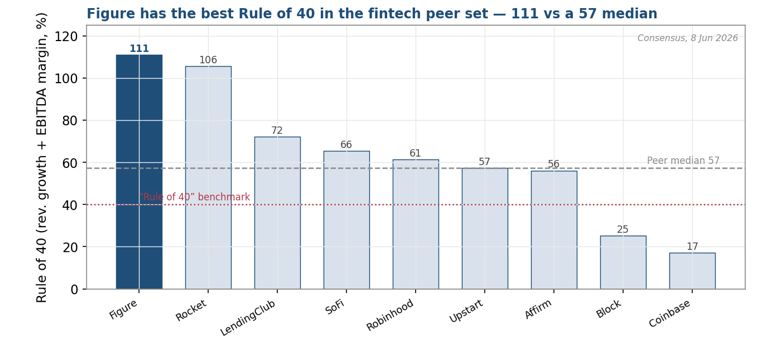
Yet the shares, at $27.86, sit barely above their $25 IPO and trade at about 19x fwd earnings and 11.4x EV/CY26E EBITDA, the same multiple as slower, lower margin peers. On current consensus, Figure has the best Rule of 40 in the fintech peer set at 111 against a 57 median, the highest operating margin, and the fastest revenue growth, yet carries only a modest premium on near term earnings that compresses as it compounds.
We set fair value at $53, about 92 percent above the current price, on fwd P/E and price to EBT, with an 8 year DCF as a cross check; we treat EV/EBITDA as a memo only, because funding interest is an operating cost for a balance sheet lender rather than a financing add back. This is the base case for the combined company after the Kiavi acquisition, as is the bull case; the downside assumes the deal does not complete and operations weaken, at about $35, while Figure standalone on in line operations is worth about $44. The stablecoin, tokenization and digital asset businesses carry no value in our base case and represent additional optionality. The principal risks are the regulatory treatment of the open end product, a rising delinquency trend that the gain on sale model insulates, and competition, none of which our work suggests has impaired the franchise today.
Investment Highlights
The market priced a contained, optics driven drawdown as a change in the franchise; the operating record shows the opposite.
The shares fell from $78 to the high $20s between January and April 2026 on three events, a crypto sentiment unwind, a single GAAP optics miss, and an April short report, none of which altered the trajectory of originations, revenue or margin. Over the same window adjusted net revenue grew 92% YoY in Q1’26A and marketplace volume rose 113% to a record $2.9bn. The most recent monthly print, May 2026 volume of $1.4bn, was up 135%.
Figure is the largest U.S. nonbank HELOC marketplace, compounding adjusted net revenue at roughly 66% into 2026 at a margin above 50%.
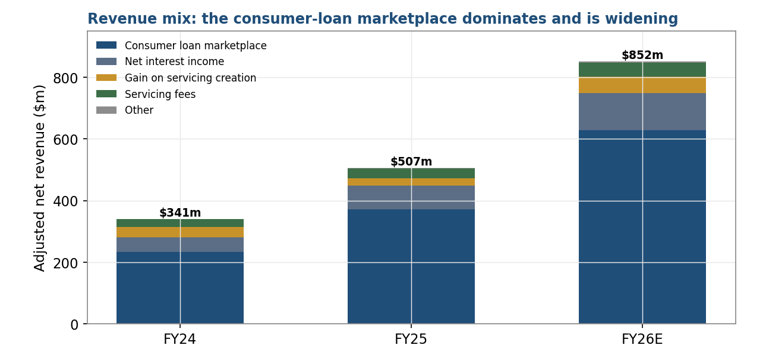
The platform facilitated $8.4bn of consumer loan volume in FY25A and monetised it at an approximately 4% net take rate. We forecast adjusted net revenue of $852m in FY26E, $1,018m in FY27E and $1,189m in FY28E, with adjusted EBITDA (ex SBC) rising from $249m to $658m and the margin widening from 49% toward 55% as the mix shifts to the capital light Figure Connect channel.
A structural cost advantage anchors the model: blockchain native origination removes most of the manual cost embedded in conventional lending.
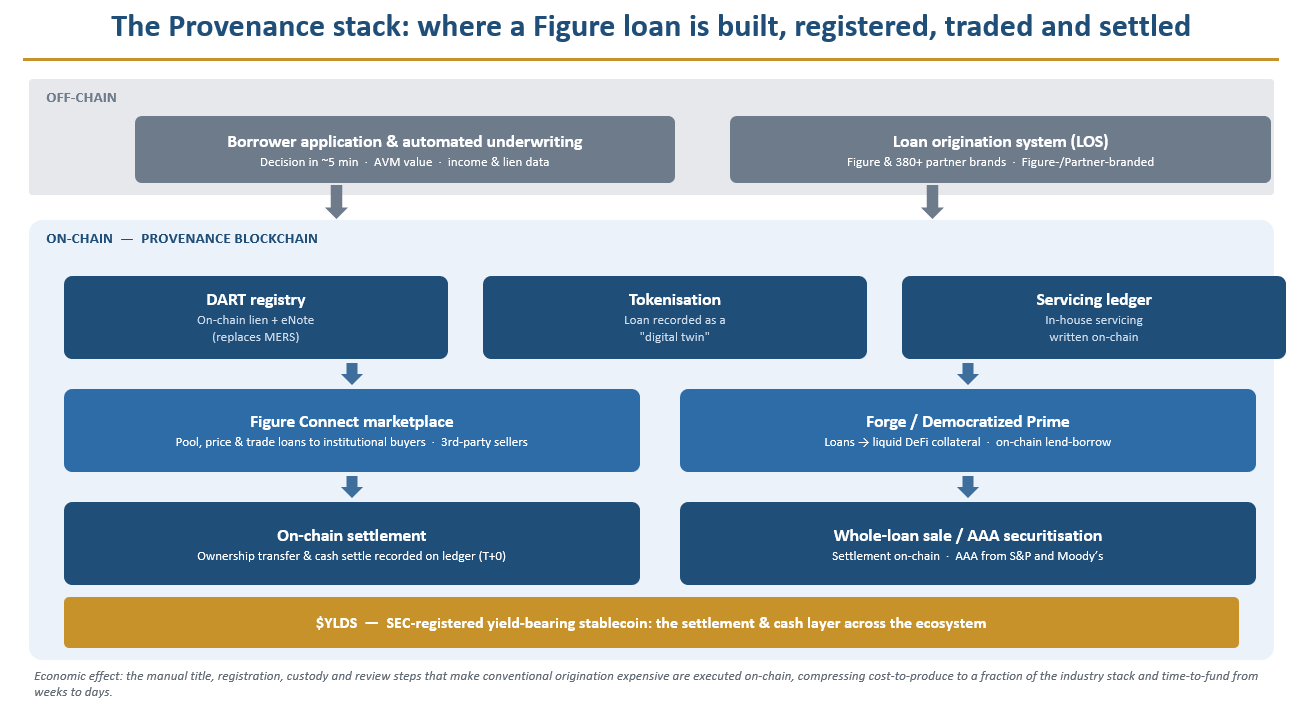
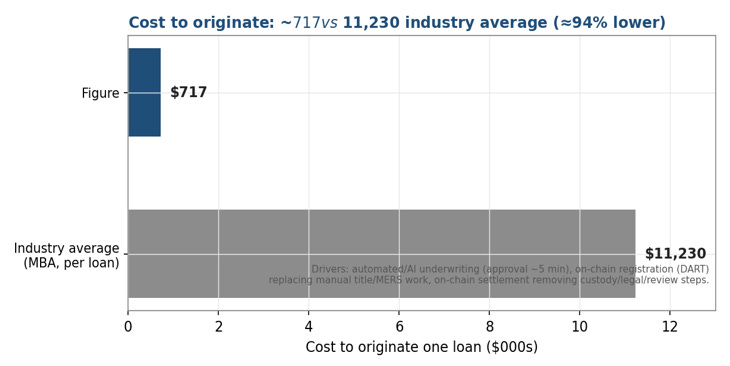
Automated underwriting, on chain lien and note registration through Figure’s DART registry, and on chain settlement together strip out the title work, manual review and third party steps that make conventional origination expensive. The result is a cost to manufacture a loan that is a fraction of the industry’s, a decision in about five minutes, and a closing in days. In Q1’26A operations and processing cost fell to 74 bps of volume from 93 a year earlier as volume more than doubled, operating leverage in real time.
The business is accelerating.
The first quarter delivered the company’s first month above $1.2bn (March, equal to 85% of all of first quarter 2025), Figure Connect rising to 56% of volume from 54%, 80 new partners, the highest quarterly addition reported, including the seventh largest lender in the country and Flagstar Bank, and a Rule of 140 result on the combination of growth and margin. Second quarter guidance of $3.8 to 4.1bn, issued for the first time, implies continued triple digit growth.
The Provenance blockchain and a leading share of real world asset tokenization form a durable moat and free optionality.
Figure originates the asset and tokenizes it as a by product of lending, then settles, trades and services it on one chain. It is the market leader in real world asset tokenization, with AAA ratings from S&P and Moody’s on multiple HELOC securitisations, the first of their kind in blockchain finance. The SEC registered YLDS stablecoin ($598m in circulation, +80% sequentially), Democratized Prime ($368m matched offers, +80%), the OPEN tokenized equity venue and a digital asset exchange carry no value in our base case.
The model generates cash; the net cash position builds and management is buying back stock.
Figure held $1.5bn of cash at quarter end against modest recourse debt and authorised a $200m repurchase that it began executing into the drawdown. Our quarterly cash flow model shows ending cash compounding to roughly $1.9bn by the end of FY28E and the net cash position deepening to about $1.4bn.
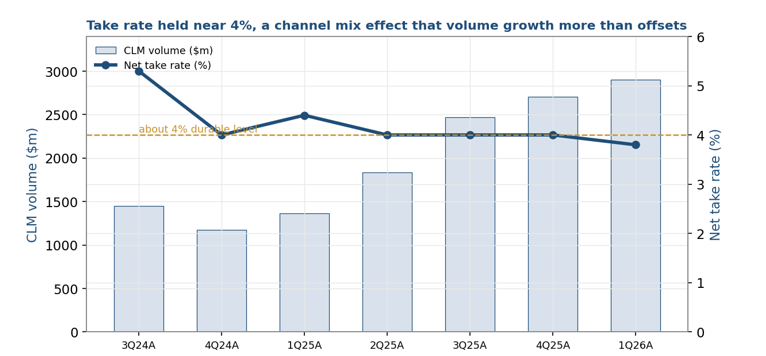
Take rate compression is a channel mix effect, and volume growth more than offsets it.
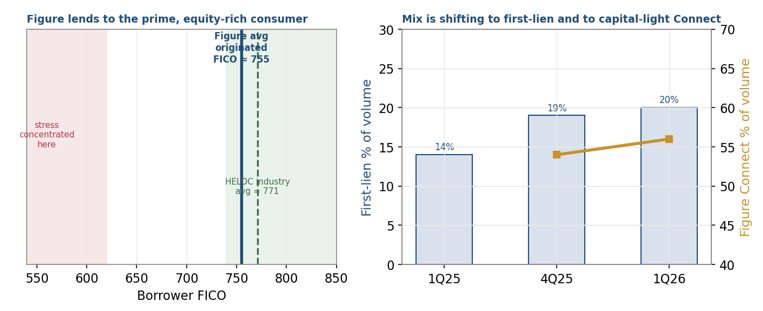
The blended net take rate was 3.8% in Q1’26A, within the company’s guided 3.5%, 4.0% range. The pressure is mix: Figure Connect and first lien volume both carry a thinner fee per dollar but a higher absolute profit per loan and almost no balance sheet use. Connect reached 56% of volume and first lien rose to 20%. The return on capital improves as the mix shifts.
Competition is intensifying across origination, rails and tokenization, and we treat it as the principal risk.
Distribution rich lenders, the incumbent owner of the mortgage registry and origination rails, and a set of institutional tokenization platforms are all pressing on parts of Figure’s value chain. No competitor today integrates origination, on chain settlement and tokenization in a single platform, but the moat will be defended, not left uncontested, and we size the position accordingly.
FIGR carries a modest near term earnings premium with the strongest quality metrics in its peer group, and that premium compresses as it compounds.
On current consensus (8 June 2026) Figure trades at about 30x CY26E GAAP P/E against an 18x peer median, so it is not the cheapest name on a headline multiple. On the quality measures we track it ranks at or near the top of the group: a Rule of 40 of 111 against a 57 median, a 40% EBIT margin against 12%, a 22% LTM ROE against 7%, and 59% fwd revenue growth against 11%. On fwd P/EBIT (19x versus 21x) and on a growth adjusted basis it screens as the lower multiple, higher quality name, and the multiple falls to 14x CY27E P/EBIT and 22x CY27E P/E as it grows.
Fair value is $53, about 92% above the current price, with Kiavi consolidated into the base and bull cases; the downside drops the deal and weaker operations to about $35, still above the price; the reverse DCF shows the market pricing a deceleration the recent data do not show.
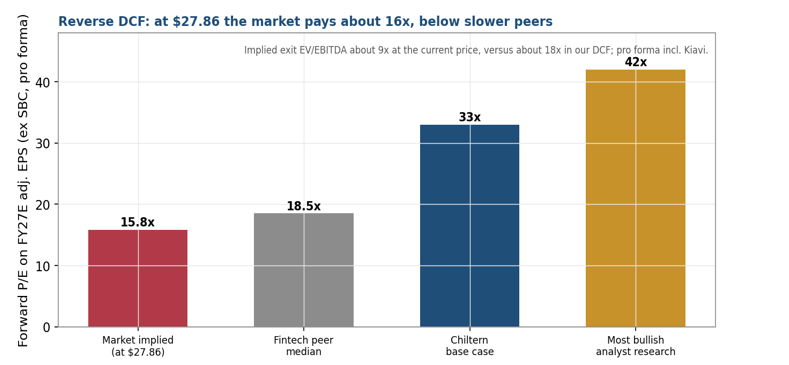
Our fair value blends fwd P/E and price to EBT, with an 8 year DCF as a cross check, and is struck on the combined company. At $27.86 the market embeds an implied exit EBITDA multiple in single digits and an implied fwd earnings multiple under 16x for a business growing volume above 100% at a 50% plus margin and generating cash.
Company Overview
Figure Technology Solutions, founded in 2018 by Mike Cagney and listed on Nasdaq on 11 September 2025 at $25 a share, operates a vertically integrated consumer lending platform built on its own public blockchain, Provenance. The company originates, underwrites, registers, services and distributes loans, predominantly home equity lines of credit, and connects loan originators to institutional capital through the Figure Connect marketplace. By cumulative volume, Figure and its partners have originated more than $26bn of home equity, making it the largest nonbank HELOC provider in the country.
The platform is a two sided marketplace. Figure and its 380 plus origination partners produce HELOCs on a common loan origination system; institutional buyers acquire that flow, increasingly through Figure Connect, where third party sellers trade loans they originated on Figure’s rails. Figure earns origination fees, ecosystem and technology fees, gains on sale, gains on the servicing assets it creates, servicing fees and net interest income across the chain. Because registration, custody and settlement run on chain, the marginal cost of clearing a loan is a fraction of the conventional stack, which is the foundation of the cost advantage examined throughout this report.
Figure facilitated roughly $5bn of consumer loan volume in FY24A and $8.4bn in FY25A, and is running well above that pace in FY26E. Adjacent to the core marketplace sit a set of venture stage products, the SEC registered YLDS yield bearing stablecoin, the Democratized Prime on chain lending marketplace, the OPEN tokenized equity venue, Forge, and a digital asset exchange. These contribute negligible revenue today and are valued here at zero, so the entire valuation rests on the lending marketplace.
A Short History of Figure
Figure was founded in 2018 by Mike Cagney, the cofounder and former chief executive of SoFi, on the thesis that the cost of credit could be lowered by moving its plumbing onto a blockchain. The company built the Provenance blockchain and, on it, an end to end home equity lending stack: automated underwriting, the DART on chain lien and note registry, tokenized loans, and on chain settlement. The first HELOC was originated in 2018, and over the following years Figure scaled that single product into the largest nonbank home equity programme in the country, cumulatively originating more than $26bn of home equity.
The scaling happened through the most hostile rate environment for mortgage finance in four decades. As policy rates rose through FY22A and FY23A and industry wide origination contracted, Figure kept growing volume and inflected from losses to a 30% adjusted EBITDA margin in FY24A and 49% in FY25A. The gains came from cost and share, which is the clearest evidence that the blockchain stack is a genuine cost advantage and not merely a narrative.
The strategic turn was the launch of Figure Connect in June 2024, which converted Figure from a balance sheet originator into a capital light marketplace where third parties originate and trade on its rails. Connect crossed half of marketplace volume for the first time in Q4’25A and reached 56% in Q1’26A. Around the marketplace the company layered a set of blockchain products: the $YLDS stablecoin in February 2025, the Democratized Prime on chain lending venue in June 2025, and the OPEN tokenized equity venue in FY26E.
Figure listed on Nasdaq on 11 September 2025 at $25 a share, raising about $787m at roughly a $4bn valuation. The shares rose sharply into a broad crypto and stablecoin sentiment rally, peaking near $78 in January 2026, before a single GAAP optics quarter in February and an April short report unwound the speculative premium. The IPO lock up expired in March 2026 and the shares rose 21% that day. The Q1’26A, reported in May, was the strongest in the company’s history. The shares trade at $27.86 today, about 11% above the IPO price and 64% below the January peak.
How Figure Works: The Technology and Provenance
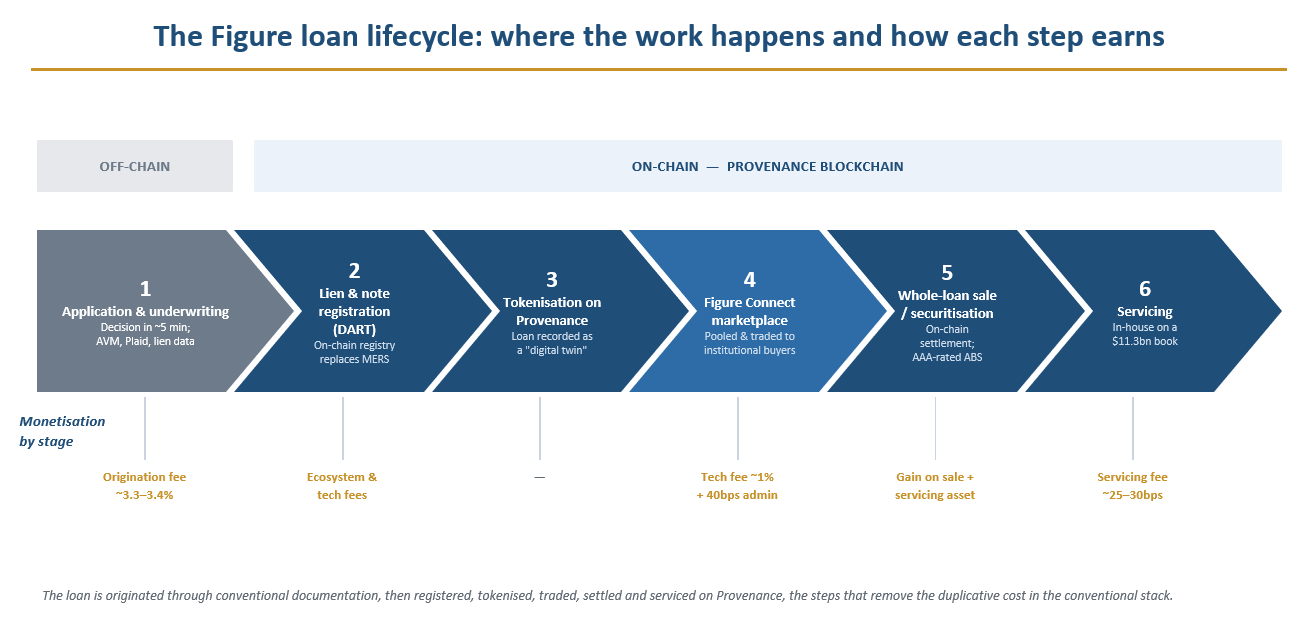
To understand the economics it helps to follow a single loan through the system, because the technology is the cost structure. Figure’s claim is that the registration, custody, transfer and settlement of a loan, the steps that make conventional origination slow and expensive, are executed on a public ledger, and that this is what produces the margin. We set out the stack, then the lifecycle, then where each step earns.
Provenance, DART and the on chain registry
Provenance is a public, proof of stake blockchain that Figure helped create in 2018 and on which its business runs. The component that matters most to the lending economics is DART, Figure’s Digital Asset Registry Technology, which records the lien and the electronic promissory note on chain. In the conventional system these functions are performed by MERS and by paper or quasi paper note custody, with title search and lien perfection handled by third parties for a fee on every loan. DART replaces that with a single on chain record of ownership and lien status that updates in real time and is shared by every participant. By Q3’25A DART covered the large majority of Figure’s origination volume, up from a negligible share two years earlier.
Three properties follow from putting the registry on chain. The first is cost: the title, registration and custody steps that are repeated and reconciled across parties in the conventional stack are executed once, on a shared ledger. The second is speed: because lien and ownership status are known and final, a HELOC can be decisioned in about five minutes and funded in days rather than weeks. The third is composability: once a loan exists as an on chain record, it can be pooled, sold, financed and tokenized without leaving the ledger, which is what makes Figure Connect, the securitisation pipeline and the tokenization products possible on the same rails.
Tokenization: the loan as a digital twin
After registration, the loan is recorded on Provenance as a tokenized digital twin, a programmable on chain representation of the asset and its cash flows. Tokenization is what lets the loan move through the rest of the chain without re papering: it can be contributed to a pool, offered to buyers on Figure Connect, sold into a securitisation, or pledged as collateral, with ownership and settlement recorded on the same ledger. Figure is the market leader in real world asset tokenization, and the AAA ratings it has obtained from S&P and Moody’s on multiple HELOC securitisations, the first such ratings in blockchain finance, are the external validation that the on chain record is robust enough for the most conservative institutional buyers.
Settlement and $YLDS
Settlement of the cash leg runs through $YLDS, an SEC registered, yield bearing stablecoin that functions as a tokenized money market instrument and as the cash and settlement layer across the ecosystem. When a loan or a pool changes hands, the asset token and the cash token settle against each other on the ledger, which removes the settlement lag and counterparty steps of conventional clearing. $YLDS in circulation reached $598m at the end of Q1’26A, up 80% sequentially, as activity across the ecosystem grew. We assign $YLDS no value, but it is the connective tissue that makes the rest of the chain settle cheaply.
The six step lifecycle below shows how a loan passes from application to servicing, which side of the chain each step occurs on, and how Figure earns at each one.
Business Segments and How Figure Makes Money
Figure reports as a single operating segment, but its revenue is produced by four economically distinct activities layered on the one technology stack: the consumer loan marketplace, loan servicing, net interest income from the capital markets pipeline, and the venture stage blockchain products. The marketplace is the engine; the others either grow with it or sit on top of it as optionality.
Segment I: The consumer loan marketplace
The consumer loan marketplace is the largest activity, accounting for roughly three quarters of adjusted net revenue (about $629m of $852m in FY26EE). It earns four fee lines as a loan is produced and sold: an origination fee of roughly 3.3%, 3.4% of principal; ecosystem and technology fees, which include a 3% ecosystem fee and technology offering fees; a gain on the sale of the loan, realised as the premium over par; and a gain on the servicing asset created at sale. The chief executive framed the unit of account plainly on Q1’26A call.
“Our economic level for Figure Connect and the consumer loan marketplace more broadly is take rate by volume.” Michael Tannenbaum, CEO, Q1’26A earnings call, 12 May 2026
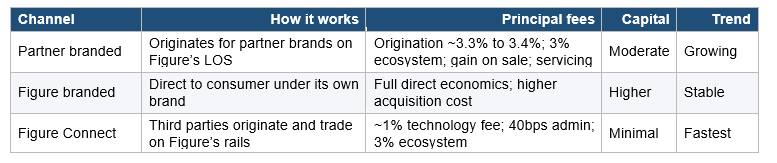
The marketplace operates through three channels with different economics and capital requirements.
Partner branded is the largest channel. Figure originates HELOCs on behalf of its partner brands, banks, credit unions and independent mortgage banks, on its own origination system, under the partner’s brand. It captures the fullest set of fees and uses a moderate amount of balance sheet while the loan transits to sale. Recent additions include Flagstar Bank, the seventh largest lender in the country, Mutual of Omaha and Five Star Bank.
Figure branded is Figure’s own direct to consumer origination. It earns the full economics but carries a higher customer acquisition cost, reflected in the sales and marketing line. The underwriting box is disclosed: a minimum FICO of 600, an average originated FICO of about 755, a maximum combined loan to value of 90% and a maximum debt to income of 50%.
Figure Connect is the marketplace channel. Third party originators produce loans on Figure’s rails and trade loans they originated themselves through the platform. Figure earns a thinner slice per dollar, a technology offering fee of roughly 1% of principal, a 40 basis point securitisation administration fee and the 3% ecosystem fee on the relevant base, while committing almost no capital. Connect reached 56% of marketplace volume in Q1’26A, up from 54% sequentially, and management has shown that a partner’s volume roughly doubles in the six months after it goes live on Connect.
The product set within the marketplace is also broadening. First lien HELOCs rose to 20% of volume from 14% a year earlier; debt service coverage (DSCR) and residential transition loans each grew about 70%; and a small business channel reached nearly $60m in Q1’26A. Management sizes the addressable origination opportunity across these products at roughly $100bn.
Segment II: Servicing
Figure retains the servicing on the loans it sells. At the point of sale it recognises a gain on the creation of the servicing asset, and it then earns an ongoing servicing fee of roughly 25 to 30 bps a year on a large and growing serviced book. Servicing is performed in house, with the records maintained on chain, and the asset carried at fair value. The two associated revenue lines, the gain on servicing creation (about $55m in FY26EE) and servicing fees (about $45m in FY26EE), together form an annuity like stream that grows with the serviced book and is less cyclical than origination.
Segment III: Net interest income and the capital markets pipeline
Figure earns interest on loans held for sale before they are sold and on a portfolio of marketable securities. Loans held for sale ended Q1’26A at $500m, up $100m since year end, in part a deliberate retention to seed Democratized Prime. The loans are funded by warehouse lines priced at roughly SOFR plus 2.25% and carry a high coupon while held, so the net interest margin is the spread between coupon and funding cost over a brief holding period. Net interest and securities income, about $119m in FY26EE, is therefore sensitive to rates: lower benchmark rates reduce the warehouse funding cost and widen the carry. The capital markets desk clears the marketplace through whole loan sales and securitisations, five priced in the first months of 2026 for nearly $1.9bn of notional.
Segment IV: The blockchain products (valued at zero)
Figure’s blockchain layer supports a set of venture stage products that monetise the same rails: YLDS, the stablecoin and settlement layer; Democratized Prime, an on chain lend borrow marketplace that ended the quarter with $368m of matched offers, up 80% sequentially, and added three third party borrowers including a DSCR originator and a small business lender; OPEN, a venue for tokenized public equity; Forge, which turns loans into liquid DeFi collateral; and a digital asset exchange. These are early and, in places, supported by Figure itself. We assign them no value, which means the optionality, and the strategic position in tokenized asset settlement they generate, is unpriced in our base case.
Unit Economics: The Money in a Single Loan
It is worth making the per loan economics explicit, because they are the whole thesis in miniature. As a loan is produced and sold, Figure earns a stack of disclosed fees; the blended result is a net take rate of roughly 3.8%, 4.0% of volume. The table sets out the components at their disclosed rates.
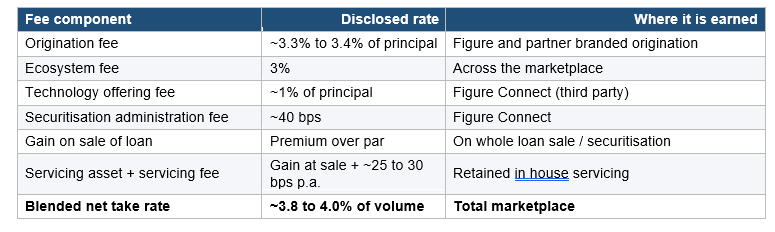
Two features make these economics unusually durable. First, the cost side: because registration, custody and settlement run on chain, the cost to produce a loan is a fraction of the conventional stack, so a 3.8% take rate drops to a 50% adjusted EBITDA margin, a conversion a conventional originator on the same fee cannot match. Second, the capital side: in the Figure Connect channel a third party originates and the loan is sold quickly, so Figure earns the technology and ecosystem fees while committing almost no balance sheet. The result is a high margin and a high return on capital at the same time, which is what the Rule of 140 result captures. As the mix shifts toward Connect and first lien, the headline take rate per dollar falls while the absolute profit per loan and the return on capital rise, the chief executive’s point that the economic unit is take rate multiplied by volume, not the take rate alone.
The Moat
A cost advantage is only a moat if it compounds and is hard to copy. Figure’s does both. The mechanism is a flywheel: blockchain native origination produces the lowest cost to manufacture a loan; that cost advantage can be shared with partners through Figure Connect; partners bring volume, which roughly doubles within six months of joining; more volume deepens the marketplace and the securitisation buyer base; a deeper, more liquid market tightens funding spreads; and tighter funding lowers the all in cost again.
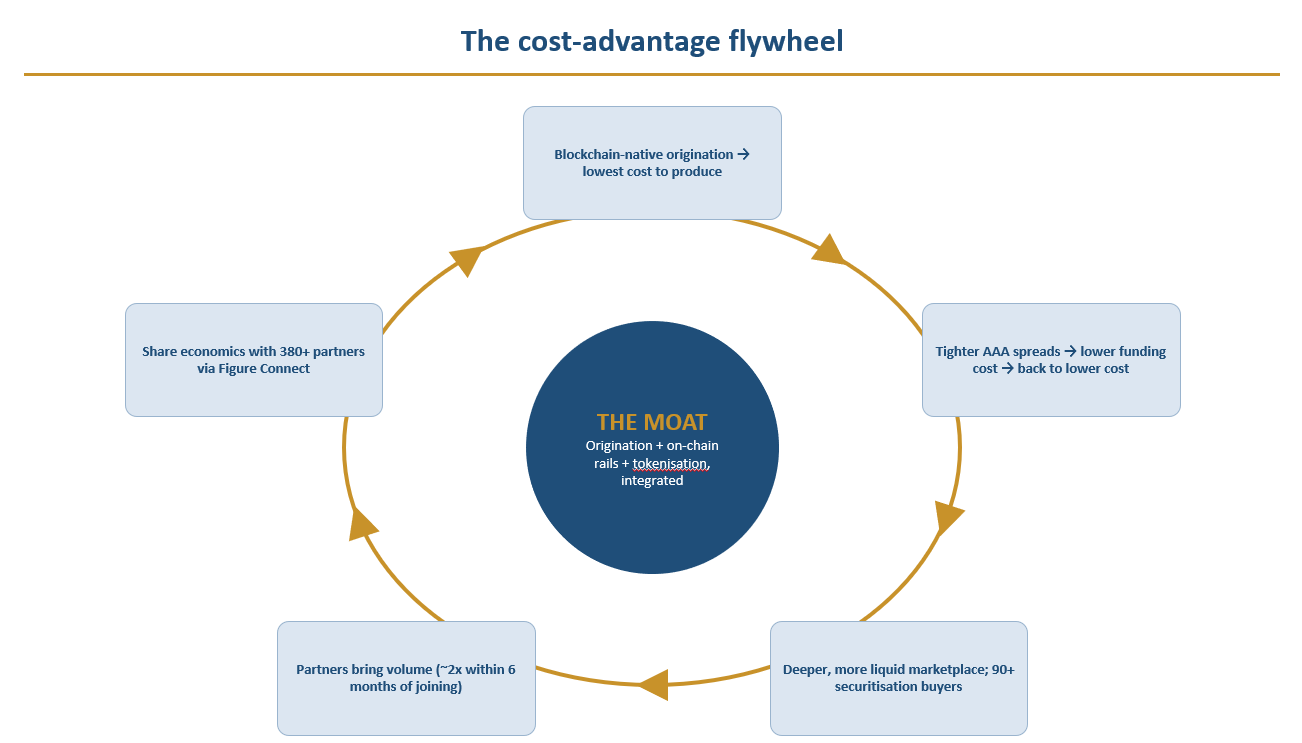
The integration is the barrier. Figure originates the asset, registers and tokenizes it, trades it, settles it and services it on one chain. A competitor can attack any single layer, origination, a registry, a tokenization platform, but none today combines all of them, and it is the combination that produces the cost position. The chief executive’s point about the ecosystem is that the surrounding products exist to deepen the core marketplace.
“All of this tooling that we provide in this broader ecosystem ultimately greases the wheels of Figure Connect, and that’s why you’re seeing [the majority] of volume and why folks like Mutual of Omaha are flocking to this and also increasing their volume by such amounts when they do so.” Michael Tannenbaum, CEO, Q1’26A earnings call
The capital markets moat: a deep, repeat buyer base
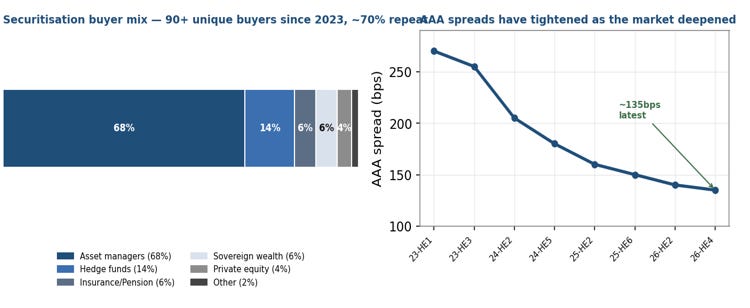
The other half of the moat is on the funding side. The value of a lending marketplace is the depth and stability of the capital that clears it, and Figure’s securitisation programme has built exactly that: more than 90 unique buyers since 2023, of which roughly 70% are repeat buyers across multiple deals, spanning asset managers, hedge funds, insurers, pensions, sovereign wealth funds and private equity. As the programme matured, AAA spreads on Figure’s HELOC securitisations tightened materially, lowering the cost of funds and feeding back into the flywheel. A new entrant would need years to assemble a comparable buyer base and ratings history.
One blockchain, three revenue pillars
The same rails support three pillars: debt and structured finance (the marketplace, Forge and securitisation), capital markets (Democratized Prime and the institutional pipeline), and equity and digital assets (OPEN and the exchange), with YLDS and DART underneath as the settlement and registry layer. We capitalise only the first pillar; the second and third are unpriced optionality that costs little to pursue because it reuses the existing infrastructure.
The cost structure, quantified
The cost advantage shows up directly in the numbers. A conventional mortgage originator’s fully loaded production cost runs into the thousands of dollars per loan; Figure’s on chain process removes the largest of those line items, and the saving funds both the margin and the economics it shares with partners. In Q1’26A, operations and processing cost fell to 74 bps of volume from 93 a year earlier even as volume more than doubled, the cost base scaling slower than volume in real time.
The Marketplace Engine: Connect, Capital Markets and the 2026 Strategy
The chief executive describes Figure Connect as the operating system for how capital flows through the ecosystem, and the logic of the business follows from that. The more volume that routes through Connect, where third parties originate and trade on Figure’s rails, the less balance sheet Figure uses and the more durable its margin becomes. Connect launched in June 2024 and crossed half of marketplace volume for the first time in Q4’25A.
“Marketplaces are not software features, they are trust systems. They require standardized assets, consistent underwriting, clean data, transparent performance history, deep institutional relationships on both sides of the market, and credibility with rating agencies and securitization buyers. They require repeat investors who trust the standardization of the asset. You cannot simply AI your way into that.” Michael Tannenbaum, CEO, Q4’25A earnings call
That observation is the heart of the competitive case. The hard part of a lending marketplace is the accumulated trust, the standardisation, the ratings history and the repeat buyer base, that lets institutional capital clear the assets at scale. Figure has built that over seven years and across more than 90 securitisation buyers, and a new entrant cannot assemble it quickly.
On the supply side the same dynamic compounds. A partner that joins Connect roughly doubles its volume within six months, because Figure supplies the distribution, the economics and the scalability. That uplift is why partner additions are accelerating, with 80 added in Q1’26A, the highest on record, including the seventh largest lender in the country and Flagstar Bank, and why management describes partners as flocking to the platform.
Management frames 2026 around three reinforcing pillars: scaling the marketplace through Connect to make the model more capital light; broadening the products inside the marketplace into mortgage adjacent categories such as first lien HELOCs, DSCR and small business loans, where partner relationships already exist; and expanding the blockchain ecosystem of tokenization, on chain lending and atomic settlement around the marketplace. Each pillar feeds the others, and all three rest on the same rails.
The capital markets desk turns originated volume into cash. Figure clears the marketplace through whole loan sales and AAA rated securitisations, five priced in early 2026 for nearly $1.9bn, into a buyer base of more than 90 institutions, about 70% of them repeat buyers, with AAA spreads that have tightened as the programme matured. The depth and stability of that capital is itself a barrier, and it is what lets the marketplace scale without Figure carrying the loans.
The Market Opportunity
Figure frames its opportunity across six markets that sit on the same blockchain infrastructure. The first is its established business; the others are progressively earlier extensions of the rails into adjacent pools of debt, collateral and equity. We summarise the company’s own disclosed market sizes and the addressable opportunity it attributes to each, then state how we treat them in valuation.
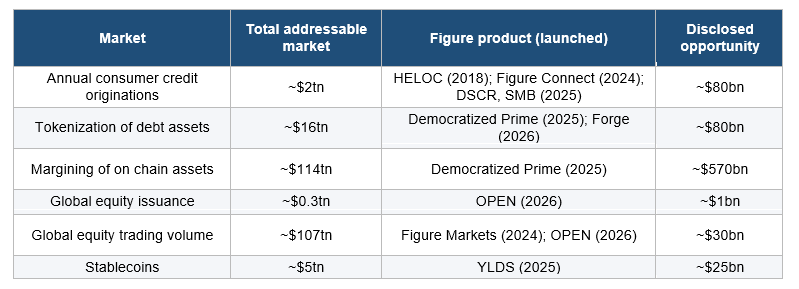
The first line is the one we underwrite. U.S. consumer credit origination is a roughly $2tn annual market, and within it home equity is structurally under served: tappable home equity stands near record levels while the share withdrawn each year remains far below pre 2008 norms. Against $8.4bn of 2025 volume, Figure has captured a low single digit share of an opportunity it sizes at about $80bn, which leaves a long runway in the core business alone before any of the newer markets is considered.
The remaining five lines are the optionality. Tokenization of debt, on chain margining, tokenized equity issuance and trading, and stablecoins are very large markets at a very early stage of on chain migration, and Figure already holds a leading position in real world asset tokenization. We do not capitalise any of them. Their value to the thesis is asymmetric: they cost little to pursue because they reuse the existing rails, and any one of them reaching scale would be additive to a valuation that already stands on the lending marketplace alone.
Who Uses Figure: Customers and the K Shaped Consumer
Figure has two distinct customer bases, the institutions that originate and buy on its platform, and the households that borrow, and the credit case rests on the second. We take each in turn.
The institutional customers: partners and buyers
On the supply side, Figure’s customers are the 380 plus origination partners that produce loans on its rails, banks, credit unions, independent mortgage banks and, increasingly, large institutions. The first quarter added 80 partners, the highest quarterly addition the company has reported, including Flagstar Bank, the seventh largest lender in the country, alongside names such as Mutual of Omaha and Five Star Bank. Management noted that bank originators and institutional depositories are increasing their activity on the platform, with recent regulatory shifts cited as a tailwind. On the demand side, the customers are the 90 plus institutional securitisation buyers that clear the marketplace. The breadth of both bases is itself a competitive asset.
The borrower: prime, equity rich, and insulated
The household borrower is where the short case concentrates, so it is worth being precise. Figure lends to the top of the credit distribution: an average originated FICO of about 755, a minimum of 600, a maximum combined loan to value of 90% and a maximum debt to income of 50%. The broader HELOC borrower averaged a FICO around 771 in FY24A, and borrowers with scores above 760 hold roughly two thirds of all tappable home equity. A homeowner with substantial equity and a prime score is, on the present evidence, among the most insulated consumers in the economy.
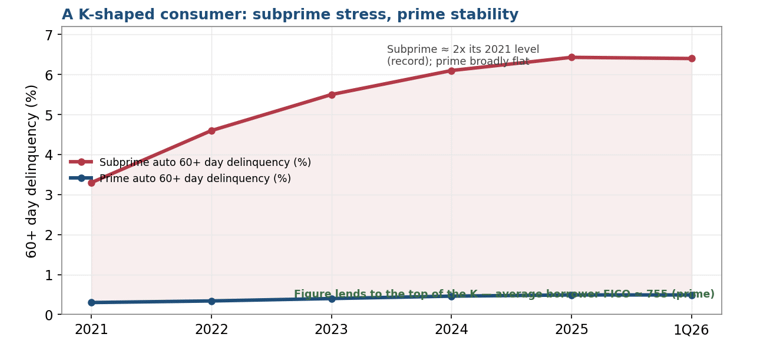
The K shaped consumer
This matters because the U.S. consumer has bifurcated. Stress is concentrated at the bottom of the distribution, subprime auto and credit card delinquency sit at or near record levels, while prime borrowers remain stable. Figure sits on the resilient leg of that K. The qualification we carry is that the rise in cash out and debt consolidation borrowing means some homeowners tapping equity may be managing stress elsewhere in their finances, which is why we track Figure’s own delinquency trend even within a prime book. The gain on sale model, under which Figure sells the loans into AAA rated securitisations rather than retaining them, limits the earnings exposure to that trend.
Five Year Historical Financials
The five year record shows a company that scaled revenue and inflected to profitability through the most hostile rate environment for mortgage finance in four decades. We read four things from it: the growth is real and accelerating, the margin compounds with scale, the cash generation is genuine, and the one soft spot is credit, which we carry as a watch item. The earnings calls add useful colour on how the company thinks about each.
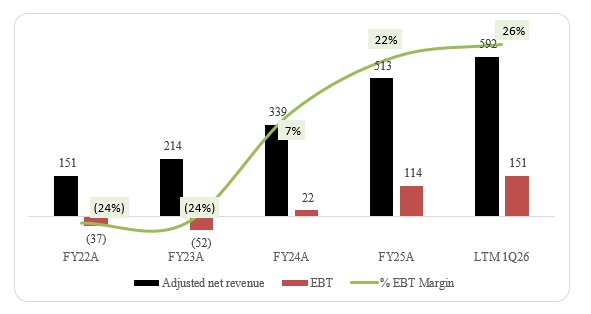
Growth is real and accelerating. Volume roughly tripled from 2022 to 2025 and then grew 113% YoY in Q1’26A, with a record single month of $1.4bn in May. Adjusted net revenue compounded from $214m in FY23A to $513m in FY25A and grew 92% in Q1’26A. This occurred while industry wide origination contracted, which points to share gain and a cost driven offering rather than a cyclical tailwind. The chief executive opened Q1’26A call by describing it as a “very strong quarter,” and the operating data supports the characterisation.
The margin compounds with scale. Adjusted EBITDA margin moved from roughly zero in FY22A to (6%) in FY23A, then to 30% in FY24A and 49% in FY25A, reaching 50% in Q1’26A. The CFO explained the mechanism on the call: the cost base is bifurcated into variable expenses, which grow with volume, and fixed expenses, technology and product, and general and administrative, which the company expects to hold broadly stable. As volume compounds against a stable fixed base, the margin expands toward the company’s 60% medium term target.
“Our expenses are bifurcated into fixed expenses and variable expenses … Fixed expenses, we do anticipate them to be pretty stable. We were pretty stable versus Q1 for both of those accounts, which is tech and product and G&A. We expect that trend to continue.” Macrina (Minchung) Kgil, CFO, Q1’26A earnings call
The cash generation is genuine and capital allocation has turned toward shareholders. Figure is GAAP profitable, held $1.5bn of cash at the end of Q1’26A against modest recourse debt, and within months of listing authorised a $200m buyback that it began executing into the post earnings drawdown. The decision to repurchase stock in the high $20s is a clear statement of where management sees value.
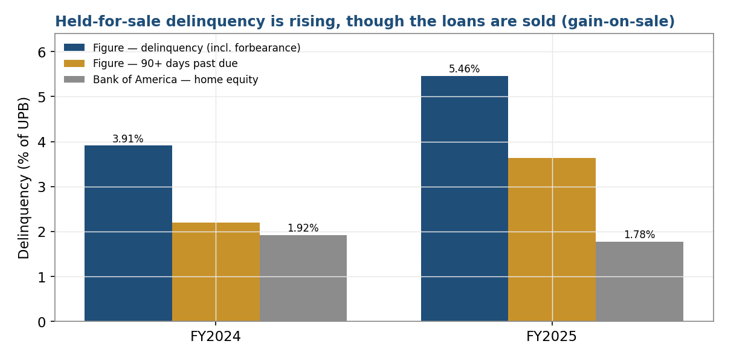
Credit is the soft spot. Delinquency on loans held for sale rose from 3.91% in FY24A to 5.46% in FY25A. Its earnings impact is muted by the gain on sale model, under which loans are sold into AAA rated securitisations rather than retained, so Figure does not keep the credit risk. We nonetheless track the trend each quarter and treat it as a genuine watch item, addressed in the risk and short report sections.
Industry Backdrop and the Macro Variables That Matter
Figure’s core business is HELOC origination, and three macro variables drive it: the level and direction of interest rates, the size and utilisation of tappable home equity, and the credit health of the prime borrower. Each currently points the same way. We treat rates as the single most important external variable, so we take it first and in some detail.
How rates affect the business
Rates touch Figure through three channels, and lower rates help all three. The first is borrower demand: a HELOC is priced off short term benchmarks, so a lower policy rate reduces the borrower’s cost and increases the propensity to tap equity. The second is funding cost: loans held for sale are financed on warehouse lines priced at roughly SOFR plus a spread, so a lower benchmark directly reduces Figure’s cost of carry and widens the net interest margin on loans awaiting sale. The third is execution: lower and more stable rates compress securitisation spreads and lift the gain on sale, because buyers pay more for the same cash flows when the discount rate falls. A rising rate environment reverses each of these, which is the genuine cyclical risk in the model.
The set up today is favourable. After the steepest tightening cycle in four decades, policy rates have begun to ease, and HELOC origination has been running at a post 2008 high even before the full benefit of lower rates is felt. The exhibit shows the relationship between the easing benchmark and the rising origination volume.
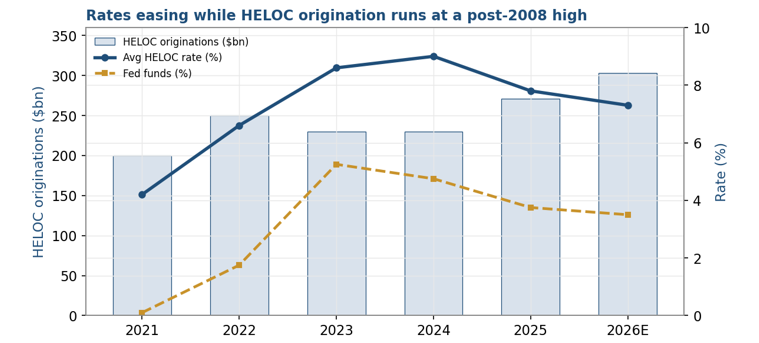
It is worth stressing that Figure built its margin through the worst of the tightening cycle, when origination contracted across the rest of the industry. The gains therefore came from cost and share, and a friendlier rate environment is an additional tailwind rather than the source of the growth.
A large, under utilised pool of home equity
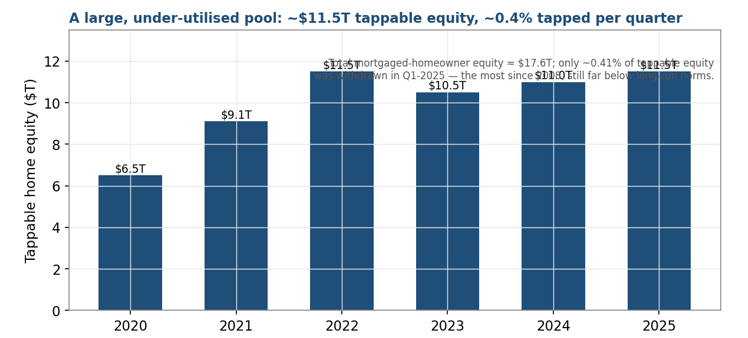
U.S. homeowners hold record tappable home equity, on the order of $11tn, while the share withdrawn each year remains far below pre 2008 norms. The pool is large, the utilisation is low, and the cash out and debt consolidation use case has strengthened as households manage higher costs elsewhere. This is the structural backdrop against which Figure’s volume growth sits, and it is the reason a low single digit share of a $2tn origination market still leaves a long runway.
Accelerating, Not Decelerating
The most important question for the stock is the direction of the second derivative. A high growth company that is quietly decelerating deserves a falling multiple; one that is still accelerating into a depressed multiple is mispriced. On every operating measure we can find, Figure is accelerating.
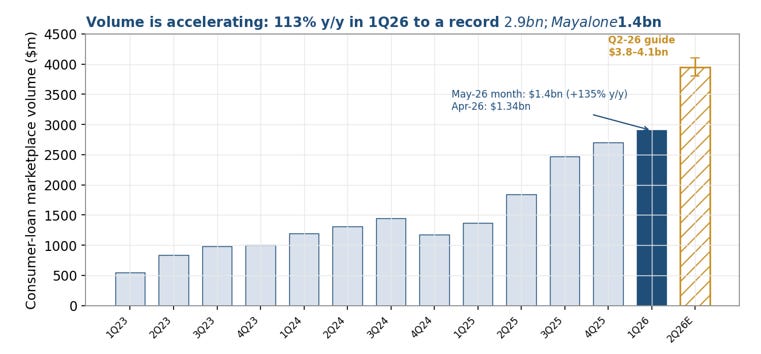
Marketplace volume grew 113% YoY in Q1’26A to a record $2.9bn, and the sequential cadence is rising: March was the first month above $1.2bn and by itself equalled 85% of the entire Q1’25A; April reached $1.34bn and May $1.40bn, the latter up 135% YoY. Second quarter guidance of $3.8 to 4.1bn, the first formal guidance the company has issued, implies the growth rate is holding in triple digits rather than fading. Figure Connect rose to 56% of volume from 54% sequentially; first lien volume rose to 20% from 19%; partner additions hit a record 80 in Q1’26A; and the combination of 92% revenue growth and a 50% margin produced what the company calls a Rule of 140 result, more than three times the Rule of 40 benchmark used to judge software businesses.
Two further points argue for durability rather than a sugar high. First, the growth is broadening: DSCR, residential transition and small business products each scaled in Q1’26A, and Democratized Prime and YLDS balances each grew 80% sequentially, so the company is not relying on a single product or channel. Second, the company is converting growth into efficiency: AI tooling lifted engineering productivity by 25% and customer chat containment by 70%, and the operations cost ratio fell even as volume doubled. A business that is decelerating does not simultaneously set volume records, raise its product breadth, and lower its unit cost.
On Chain and Alternative Data
Because Figure runs its lending on a public blockchain, much of its operating activity is observable on chain, independent of the company’s own reporting. We track three sets of alternative data: Provenance chain metrics, the adoption of Figure’s on chain registration and tokenization rails, and the broader crypto and stablecoin market in which the digital asset businesses sit. The on chain data are a useful, higher frequency check on the reported financials, and through the first quarter of 2026 they corroborate the reported acceleration rather than contradict it.
Provenance, the public blockchain Figure built and on which it settles, has grown steadily. On chain total value locked rose from about $17.3bn in September 2025 to about $22.9bn in March 2026, an increase of roughly 32% in six months. Over the same period the number of participants on the chain rose from about 57,000 to about 72,000, and the on chain loan balance rose from about $12.7bn to about $16.8bn. Monthly consumer loan volume funded on chain ran between roughly $0.7bn and $1.2bn through the period and stepped up into early 2026, consistent with the record $2.9bn of marketplace volume the company reported for the first quarter.
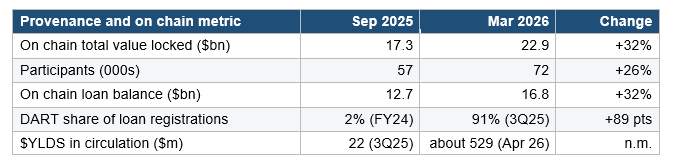
The share of Figure’s loan registrations recorded through its digital asset registration technology, DART, rose from about 2% in 2024 to about 91% by the third quarter of 2025. That migration matters because it is the mechanism by which the loan lifecycle, lien and note registration, custody and transfer, moves on chain, and it is the source of the cost advantage discussed earlier. The on chain footprint is therefore becoming the system of record for the core lending business rather than a side project.
On tokenization, third party trackers put roughly $15bn of tokenized private credit on chain, with Figure among the larger issuers. The company’s yield bearing stablecoin, $YLDS, grew in circulation from about $22m in the third quarter of 2025 to a few hundred million dollars by the spring of 2026. These figures are small relative to the lending business, and we carry the stablecoin, tokenization and digital asset venues at zero in our base case, but the on chain data show early, measurable traction rather than announcements alone.
The crypto and stablecoin market that the digital asset venues sit within is large and cyclical. Total crypto market capitalisation has ranged in the low trillions of dollars, and stablecoin supply has continued to grow. Figure Markets, the exchange, is early stage, and we do not credit it in the base case. We note the backdrop mainly to size the optionality and to flag that the digital asset lines carry market driven volatility that the lending marketplace does not.
The Kiavi Acquisition
On 10 June 2026 Figure agreed to acquire Kiavi, the largest lender of residential transition loans (RTL) in the United States, in a transaction valued at $717m. Figure contributes $538m for Kiavi’s technology and operating platform and its DSCR loan book, while a joint venture between Figure and Sixth Street, into which Sixth Street contributes $179m, acquires Kiavi’s RTL loan assets. The platform purchase is funded by a planned $600m issue of senior unsecured notes, which leaves pro forma corporate leverage below 2.0x. The transaction is expected to close in the second half of 2026, subject to regulatory approval.
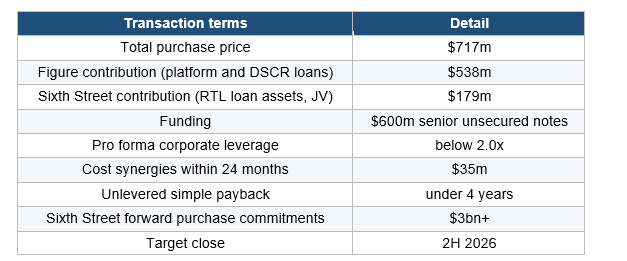
Kiavi, founded in 2013 as LendingHome, has funded more than $30bn of loans to residential real estate investors and originated a record $6.5bn in 2024, up 46% YoY, with momentum continuing into 2025. Its products are short term RTL, used to buy and renovate investment properties, and longer term rental loans underwritten to a debt service coverage ratio (DSCR), a product Figure already offers. Kiavi underwrites with AI, including a proprietary post renovation value engine, and reports roughly 75% repeat business, a lifetime realised loss rate near 0.50%, and 24 lifetime securitisations that give it deep, recurring access to capital markets.
Kiavi generated more than $250m of revenue in 2025, up about 30% YoY, and more than $100m of adjusted EBITDA, a margin near 40%. At $717m in total Figure is paying roughly 7x EBITDA for the combined platform and loans, and its own $538m contribution is about 5x; both sit well below Figure’s own multiple and are cheap for a platform growing 30% at a 40% margin. Figure expects $35m of cost synergies within two years as Kiavi’s origination migrates onto its blockchain rails.
The acquisition does three things. It adds more than $7bn of annual first lien volume to the Figure Connect marketplace and more than $100m a month to Democratized Prime, taking the consumer loan marketplace above 40% first lien by the end of 2027 and opening a $200bn annual origination opportunity across RTL ($116bn), DSCR ($58bn) and construction ($49bn). It keeps Figure capital light, because the loan assets sit in the Sixth Street JV, supported by more than $3bn of forward purchase commitments, while Figure earns the platform economics. And it is the first use case for Adaptor, Figure’s agentic AI onboarding product. Kiavi’s chief executive, Arvind Mohan, joins Figure as Chief Business Officer.
On our estimates the deal is accretive. Pro forma adjusted EPS rises about 20% in FY27E, the first full year, to roughly $1.76, and the unlevered payback on Figure’s $538m is just under four years. Pro forma adjusted EBITDA reaches about $710m in FY27E at a margin near 52%, consistent with the reaffirmed 60% medium term target. We now carry Kiavi in our base and bull cases, consolidating it from close, which lifts our fair value to about $53 from the roughly $44 Figure is worth standalone; the downside instead assumes the deal does not complete, and lands at about $35 once operations are flexed lower. We hold Kiavi’s margin at its disclosed level near 40% and add only the disclosed $35m of synergies, so the forward figures are our estimates, set out as explicit, changeable drivers in the model, with a completion factor that lets the deal be dialled in or out.
The acquisition carries integration risk and shifts the risk profile at the margin. RTL is more credit cyclical than HELOC, with fix and flip borrowers exposed to housing turnover and short term rates, although the 0.50% lifetime loss rate and the sale of the loans into the JV limit Figure’s direct credit exposure. The $600m of new debt reduces the net cash cushion the thesis has relied on, the transaction requires regulatory approval, and Figure’s economics depend on the forward flow arrangement with Sixth Street continuing on attractive terms. On balance we view the deal as a sensible, accretive use of Figure’s currency that broadens the first lien franchise and deepens a strategic funding partnership.
The Core Mispricing
The central question for the stock is what rate of future deceleration the current price implies, and whether the live data supports it. We answer this with a reverse DCF that solves for the growth and margin path embedded in the $27.86 share price, and then compare that path to what the business is actually doing.
At $27.86 the market values Figure at 19x P/E on CY26E adjusted EPS and 14.6x on CY28E, and at 11.4x EV/CY26E EBITDA falling to 6.8x on CY28E. Holding our discount rate and terminal assumptions, the price solves to an implied exit EBITDA multiple in the low double digits and an implied fwd earnings multiple under 20x, levels consistent with a business whose growth fades quickly to a mature rate within three years. The most bullish published analyst research values the company at roughly 42x fwd adjusted earnings; the fintech peer median sits well above where Figure trades.
The live data contradicts the implied deceleration. Volume grew 113% in Q1’26A and 135% in the latest month; the margin reached 50% against a 60% target; Figure Connect is taking share within the marketplace; and the securitisation market that clears the loans remains deep and oversubscribed, with spreads that have tightened since 2023. For the current price to be correct, this trajectory has to break sharply and soon. The base case requires only that the reported numbers continue to track the operating data, at which point the multiple normalises toward the peer set and the company’s own growth and margin profile.
Competitive Landscape and What Peers Trade At
Figure competes along three fronts, origination and distribution, the rails on which loans are registered and settled, and the tokenization of real world assets, and the competitive set differs on each. We map the principal competitors, then show what the comparable public companies trade at.
Origination and distribution
In home equity origination Figure competes with bank and nonbank lenders and with newer fintech entrants. The largest distribution threat comes from scaled mortgage and consumer finance platforms that can cross sell home equity into very large existing customer bases; against these Figure competes on origination economics and speed. A second set of fintech entrants attacks the HELOC and equity sharing space directly. Figure’s answer in this arena is Connect: by letting these and other originators produce on its rails, it converts some would be competitors into partners and monetises their volume.
Rails and tokenization
The incumbent owner of the mortgage registry and origination technology stack controls the rails most of the industry uses today; that incumbency is the competitive set for DART and Provenance, and it is formidable. Figure’s counter is that its rails are cheaper and faster and natively support tokenization and on chain settlement. Separately, a set of institutional tokenization platforms is scaling on chain issuance of private credit, treasuries and funds, often with large asset managers; Figure’s distinction is that it originates the underlying assets itself and tokenizes them as a by product of lending, where most platforms tokenize assets originated by others.
What the comparable companies trade at
We screened Figure against a fintech peer set on current consensus as of 8 June 2026. There is no perfect comparable, because no listed company combines blockchain native origination, on chain settlement and tokenization, so the set is high growth consumer lending and crypto adjacent fintech. The honest read is two sided: on headline near term multiples Figure is not the cheapest name, but on growth, margins, returns and the Rule of 40 it is the best in the group, and the premium it carries is small relative to that quality gap.
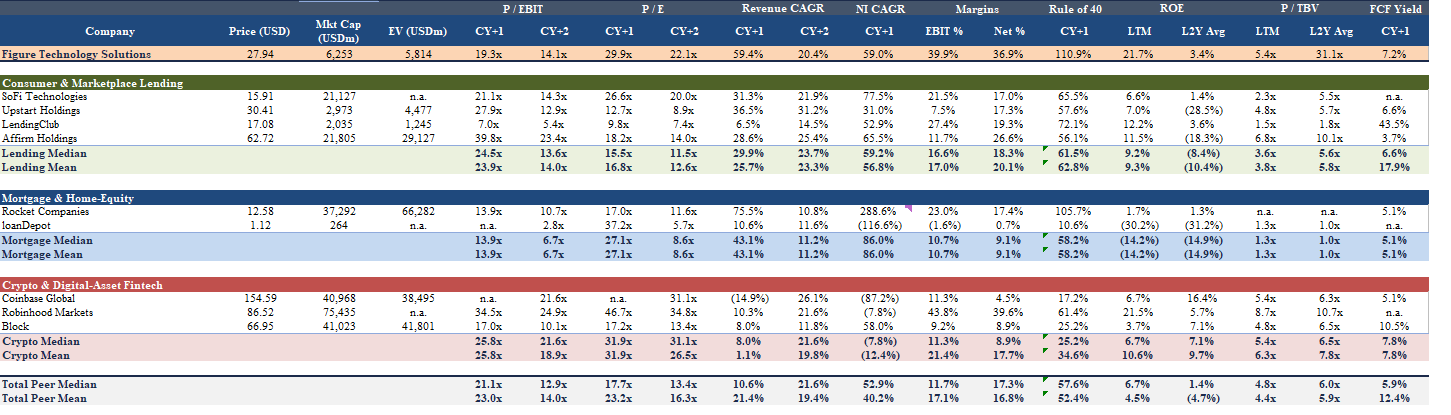
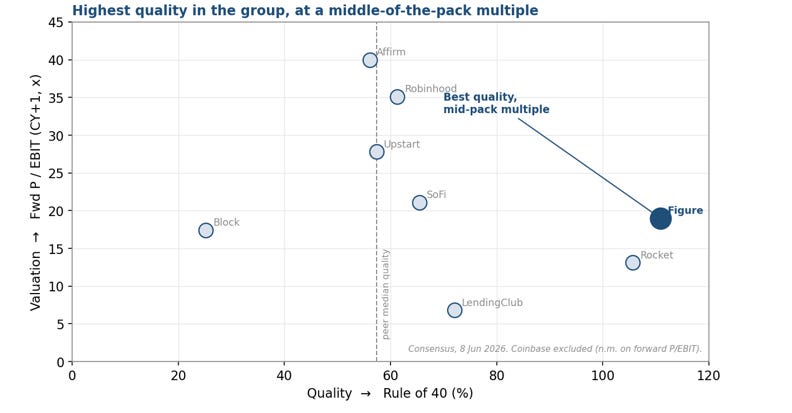
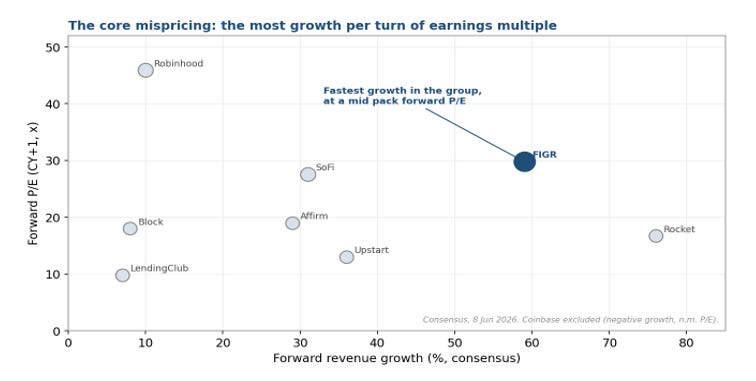
Three things stand out. First, Figure is not the cheapest name on a headline fwd P/E: at about 30x CY26E it trades above the 18x peer median. On the quality measures we track it ranks at or near the top of the group, with the highest Rule of 40 (111 versus a 57 median), the highest EBIT margin (40% versus 12%), among the highest net margins, a 22% ROE against a 7% median, and the fastest fwd revenue growth (59% versus 11%). Second, the premium is narrow once growth is taken into account: a roughly 0.5 PEG on near term earnings, a fwd P/EBIT of 19x against a 21x median, and multiples that compress quickly to 14x CY27E P/EBIT and 22x CY27E P/E as the company compounds. Third, the names that look cheaper on the screen, LendingClub at 7x P/EBIT and Upstart at 13x P/E, are slower growing or structurally lower quality, while the names of comparable quality, Robinhood at 46x P/E and Affirm at 40x P/EBIT, trade at a clear premium to Figure.
Figure is not the cheapest fintech on a headline multiple, but it ranks at or near the top of its peer group on the quality measures we track while trading only modestly above the peer median earnings multiple; at $27.86 the price is well below our fair value estimate. Two observations close the section: Figure is, for now, the only participant that integrates origination, on chain settlement and tokenization in one platform, which is the source of its cost advantage and a real barrier; and the competitive set is converging on the same opportunities, so the moat will be defended rather than left uncontested. The three things we watch are distribution scale among the large lenders, the incumbency of the existing rails, and the institutional partnerships behind the tokenization platforms.
The Competitors in Detail
The comparable set is worth examining company by company, because each peer competes with, or is valued against, Figure in a different way. The figures below are current consensus as of 8 June 2026.
SoFi Technologies (SOFI). A digital consumer finance platform offering personal loans, student loan refinancing, home loans, deposits under its own bank charter, and a brokerage. SoFi is the closest large fintech franchise to Figure, and Figure founder Mike Cagney cofounded it. On consensus, SoFi grows revenue about 31 percent and earns a net margin in the high teens, with a roughly 7 percent ROE and a fwd earnings multiple near 28 times. It is a balance sheet bank that funds loans with deposits, so it grows more slowly than Figure and earns a lower margin, but it carries far greater brand and distribution. SoFi competes with Figure in personal and home lending.
Rocket Companies (RKT). The largest United States mortgage originator and servicer. Through its 2025 acquisitions of Mr. Cooper and Redfin, Rocket assembled a servicing book of roughly $2.1tn and around 10m clients. Consensus shows a strong revenue recovery of about 76 percent off a depressed mortgage base, a 23 percent operating margin, a low single digit ROE, and a fwd operating multiple near 13 times. Rocket is the incumbent with the deepest distribution and the most direct threat to Figure home equity volumes, against which Figure competes on cost and speed rather than scale.
Upstart Holdings (UPST). An artificial intelligence lending marketplace that matches borrowers to bank and credit union partners for personal, auto and small loans, taking a fee without retaining most of the credit. Upstart is the closest structural analogue to the Figure capital light, partner funded marketplace model, though in unsecured consumer credit rather than home equity, and with more cyclical, credit sensitive volumes. Consensus shows about 36 percent revenue growth, a thin operating margin near 8 percent, a 7 percent ROE and a fwd earnings multiple around 13 times. It screens cheaper than Figure but at lower quality.
Affirm Holdings (AFRM). A buy now, pay later platform providing point of sale instalment loans to consumers at merchant checkout. Affirm grows revenue about 29 percent and is only now turning consistently profitable, which leaves it on a high trailing earnings multiple near 80 times and a fwd operating multiple around 40 times, with a price to tangible book near 7 times. It is a high growth consumer credit fintech, but in a thinner margin product and at a richer valuation than Figure.
LendingClub (LC). A digital marketplace bank for personal loans that acquired a bank charter and now both retains and sells loans. LendingClub is slower growing, at about 7 percent, but solidly profitable, with a 27 percent operating margin, a 12 percent ROE, and the cheapest multiple in the group near 7 times fwd operating earnings. The discount reflects its maturity and slower growth rather than any read on Figure.
Coinbase Global (COIN). The largest United States cryptocurrency exchange, earning transaction and subscription and services revenue, including stablecoin economics. Coinbase revenue is contracting about 15 percent YoY on a cyclical basis, its margin is high but volatile, and it trades on a fwd earnings multiple in the high fifties to high sixties with a price to tangible book near 6 times. It is the crypto adjacent comparable whose valuation swings with crypto sentiment, relevant to Figure blockchain optionality rather than its lending core.
Robinhood Markets (HOOD). A retail brokerage and crypto trading application with very high incremental margins. Robinhood grows revenue about 10 percent but earns an operating margin near 44 percent and a net margin near 40 percent, with a 22 percent ROE, a fwd earnings multiple near 46 times and a price to tangible book near 9 times. It is the highest quality crypto adjacent name on margins and returns, yet it trades at a clear premium to Figure and grows far more slowly.
Block (XYZ). The diversified payments and fintech group behind the Square seller ecosystem, the Cash App and a bitcoin business. Block grows revenue about 8 percent at a 9 percent operating margin and a low ROE, on a fwd operating multiple near 17 times. It is a large, diversified fintech with slower growth and lower returns than Figure.
The names of comparable quality on growth, margin and returns, namely Robinhood, Affirm and Coinbase, trade at a clear premium to Figure on earnings. The names that trade cheaper, namely LendingClub, Upstart and Rocket, are slower, more cyclical or structurally lower margin. None of them combines origination, on chain settlement and tokenization, and none matches the Figure combination of 59% fwd revenue growth, a 40% operating margin and a 22% ROE. The most direct competitive threats are Rocket and SoFi on distribution in home lending, and Coinbase and the institutional tokenization platforms on the blockchain side.
The Short Report: A Claim by Claim Assessment
In April 2026 a short seller published a report arguing that Figure is a fast and loose lender dressed as a blockchain company. We read it in full and tested each material claim against primary sources. Our conclusion is that the report is accurate on several specific, narrow points, the regulatory characterisation of the product, insider selling, and the deteriorating delinquency trend, and misleading on its central contention that the business is stalling or fundamentally impaired. We summarise the assessment below and then carry the valid points into the formal risk section.
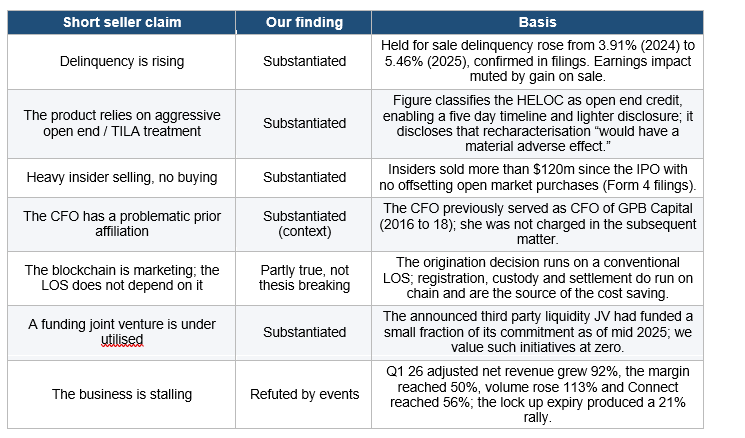
Where the report makes a specific, checkable claim about disclosure, insider activity or credit quality, it is generally correct, and we treat those points as real. Where it extrapolates from those points to the conclusion that the franchise is broken or that growth is about to collapse, the subsequent results contradict it. A short report can be right about the facts and wrong about the security, and in our view that is the case here.
Key Risks
We hold the long view with the following risks clearly in mind. The first three are the substantiated points from the short report; the remainder are the structural risks inherent in the business.
Regulatory characterisation of the product (most material). Figure treats its HELOC as open end credit, which permits a five day funding timeline and lighter disclosure. Because borrowers draw most of the line at closing, a court or regulator could recharacterise the product as closed end, which would impose TILA RESPA disclosure requirements, a waiting period and stricter ability to repay verification. Figure discloses that such a change would have a material adverse effect, and litigation and regulatory complaints reference the full draw practice. We size this as a potential constraint on funding speed and volume, not as a solvency issue, and it is the single risk we weight most heavily.
Credit deterioration. Delinquency on loans held for sale rose to 5.46% in FY25A. The gain on sale model, loans sold into AAA rated securitisations rather than retained, means Figure does not keep the credit risk, but a sustained deterioration could widen securitisation spreads, raise funding costs and slow the marketplace. We track delinquency, securitisation spreads and the buyer base each quarter.
Governance and insider activity. A multi class structure concentrates voting control with the founder, insiders have sold more than $120m with no offsetting purchases, and the founder’s communication style is promotional. We treat these as reasons to size the position conservatively rather than to avoid it, and we note the offsetting $200m buyback the company is executing.
Competition. Distribution rich lenders, the incumbent rails owner and institutional tokenization platforms are all pressing on parts of the value chain. This is the principal long term risk to the cost advantage and the moat.
Rates and housing. A renewed rise in rates or a fall in home values would reduce origination demand, raise funding costs and pressure the carry. The business grew through the last tightening cycle, which is reassuring but not a guarantee.
Optionality that does not convert. The stablecoin, tokenization and digital asset products may not reach scale. Because we value them at zero, this is a risk to upside, not to the base case.
Key Technology Risks
Figure’s cost advantage comes from running the lending stack on a blockchain, and that same dependence creates a distinct set of technology risks a conventional lender does not carry. We draw these from the company’s own risk disclosures and weight them in how we size the position. None changes our base case, but each is a genuine watch item.
The DART registry. DART, the on chain registry Figure developed to track lien and ownership status in place of MERS, is central to both the cost saving and the enforceability of the loans. Figure discloses that challenges to DART could materially and adversely affect the business. The legal recognition of an on chain lien and electronic note registry is less tested in the courts than the conventional system, and an adverse ruling on enforceability or lien perfection would be serious.
Smart contract acceptance and function. The loans and the digital assets that settle around them rely on smart contracts deployed on the blockchain. Figure discloses that if those contracts do not operate as expected, or if the fundamental premise of smart contract acceptance or function shifts, the business could be adversely affected. Smart contract bugs, exploits or unexpected behaviour are a category of operational risk specific to the model.
Dependence on the Provenance blockchain. The whole stack runs on Provenance, and a loss of access to data recorded on it, whether from fraudulent or accidental transactions, technology failures or security breaches, would disrupt origination, servicing and settlement. A public blockchain also carries governance and availability risk that a privately controlled system does not.
Custody and cybersecurity. Figure relies on third party custodians for digital assets and is exposed to their operational and cybersecurity controls; a breach or operational error at a custodian could cause loss. More broadly, a blockchain native lender is a high value target, and a successful breach of keys or systems would be material.
Cryptographic and quantum risk. The security of the system rests on public key cryptography. Figure flags the longer term emergence of quantum computing, which could shorten the time required to derive the private keys underlying current cryptography, as a future risk to the approach. This is a low probability, long dated tail, but it is specific to a blockchain business.
Digital asset regulation. The framework for stablecoins, tokenized assets and on chain securities is still evolving. An adverse change in how $YLDS, tokenized loans or the OPEN equity venue are characterised or regulated would affect the optionality we already value at zero, and in a severe case could touch the settlement layer of the core business.
Key person and internal controls. Figure depends on its management team, and on the founder in particular, and the loss of key people would be a setback for a company whose strategy is tightly held. The company has also disclosed material weaknesses in its internal control over financial reporting that it is working to remediate; until remediated, they raise the risk of a reporting error.
We hold these as reasons to size the position with care, not to avoid it. They are the price of the cost advantage: the same on chain architecture that lets Figure manufacture a loan for a fraction of the industry cost is what creates registry, smart contract and cryptographic exposures a conventional lender does not have. We track the DART and digital asset regulatory items most closely.
Management, Ownership and Governance
Figure is a founder led company with a management team drawn largely from earlier fintech successes, and with the governance features that often accompany such companies: concentrated founder control, a promotional communication style and meaningful insider selling. We summarise the team, the ownership structure and our view, and we carry the governance items into position sizing rather than into the valuation.
The leadership has built and scaled category leaders before, which we regard as a genuine asset in a business that depends on partner acquisition, capital markets relationships and regulatory navigation. On the calls, the chief executive is fluent on the operating detail and the ecosystem strategy, and the chief financial officer is precise on the cost structure and the path to the 60% margin, the bifurcated fixed and variable expense framing quoted earlier is exactly how we would model it. The founder’s record at SoFi demonstrates both the ability to create a large franchise and a history of friction with stakeholders, and his public communication style tends toward the promotional, which is part of what drew the short seller’s attention. We weight these observations in how we size the position, not in whether we hold it.
On ownership, Figure carries a multi class share structure that concentrates voting control with the founder, a common arrangement among recent technology listings and one that limits the influence of outside shareholders. Insiders have sold more than $120m of stock since the IPO with no offsetting purchases, including sales under lock up exceptions, which we treat as a sentiment signal rather than a statement about fundamentals. Against that, the company authorised a $200m buyback and began repurchasing shares into the post earnings drawdown, and the lock up expiry in March produced a 21% share price gain instead of the predicted wave of supply. Our overall read is a capable, category building team operating with governance features that warrant a discount, not avoidance, which is precisely how a price in the high $20s against a $53 fair value compensates the holder.
The founder and the team
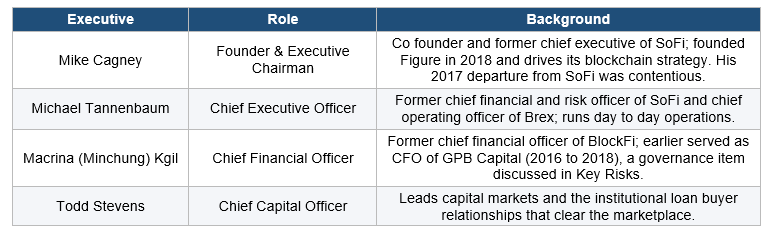
Mike Cagney’s record is the reference point for both the bull and bear views of management. He cofounded and led SoFi, building it into one of the largest U.S. consumer fintech franchises, before a contentious 2017 departure, then founded Figure in 2018 and built the Provenance blockchain and the lending stack on it. He is now Executive Chairman, with Michael Tannenbaum, formerly SoFi’s chief financial and risk officer and Brex’s chief operating officer, as chief executive running day to day operations, and Macrina (Minchung) Kgil, formerly chief financial officer of BlockFi, as chief financial officer. The team has built and scaled category leaders before, which we regard as a genuine asset in a business that depends on partner acquisition, capital markets relationships and regulatory navigation.
Governance and the dual class structure
Figure carries a dual class share structure that concentrates voting control with the founder, a common arrangement among recent technology listings and one that limits outside shareholder influence; the company discloses the related governance impacts as a risk. The board and committee structure is otherwise standard for a newly public company. We treat the concentrated control as a reason for a governance discount rather than avoidance, consistent with how the market prices founder controlled compounders elsewhere.
Capital allocation and what management says
Management’s stated priorities are consistent with the model. The chief financial officer frames the cost base as bifurcated between variable expenses that grow with volume and fixed expenses, technology and product and general and administrative, that the company expects to hold broadly stable, which is the mechanism behind the path to a 60% margin. On capital return, the company authorised a $200m buyback and executed it into the post earnings weakness, completing the authorisation within the year. On strategy, the chief executive is explicit that the surrounding ecosystem exists to deepen the core marketplace.
The governance item that draws the most attention is insider selling: insiders have sold more than $120m of stock since the IPO with no offsetting open market purchases, including sales under lock up exceptions. We treat this as a sentiment signal rather than a statement about fundamentals, since newly public founders and early employees routinely diversify, and we weigh it against the company’s own $200m buyback and the fact that the lock up expiry produced a 21% rally rather than a wave of supply. Our overall read is a capable, proven team operating with governance features that warrant a discount.
Valuation
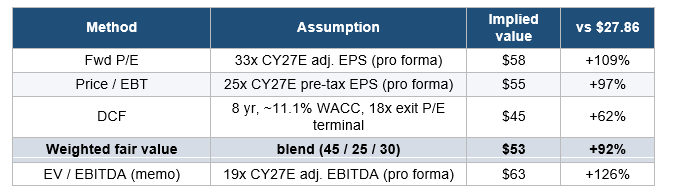
We value Figure on fwd P/E and price to EBT, with an 8 year DCF as a cross check. Our base case and bull case consolidate Kiavi from close; the downside assumes the deal does not complete and reverts to Figure standalone. Removing only the deal, at in line operations, leaves fair value at about $44; the bear case, which weakens operations as well, is about $35. EV/EBITDA is shown only as a memo, because funding interest is an operating cost for a balance sheet lender rather than a financing add back. Fwd earnings are the appropriate primary tool for a profitable, balance sheet using financial. The DCF exits on a terminal P/E of 18x in the base case, 16x in the downside and 20x in the upside, set with reference to the fintech peer median near 18x and the level the intrinsic terminal multiple supports as the equity beta normalises toward the market. On a book value basis Figure trades at roughly five times book for a ROE above 20%, broadly consistent with the earnings based fair value and a further check that the shares are not expensive on the measures used for financials. At $27.86 the stock trades at 19x P/E on CY26E adjusted EPS and 14.6x on CY28E, 11.4x EV/CY26E EBITDA falling to 6.8x on CY28E, and a FCF yield that rises from roughly 5% toward 6%, the bottom of the fintech peer group despite top of group growth and margins.
The implied price table applies a range of multiples to our forecasts so the reader can see the sensitivity. Even at the low end of each range, well beneath the most bullish published research and the peer median, the implied value sits above the current price.
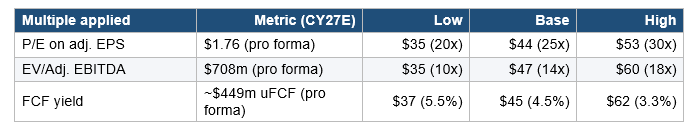
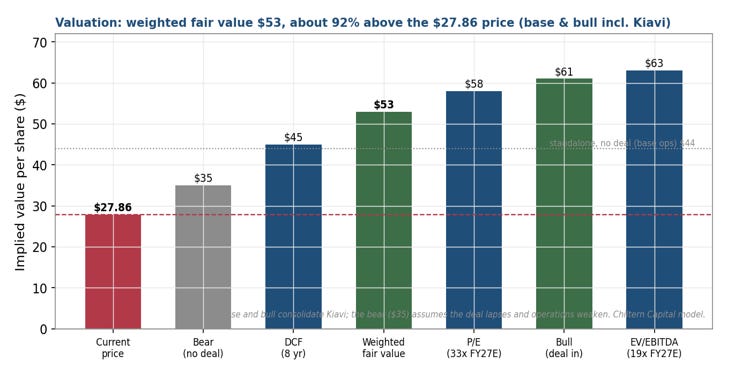
The three primary methods produce a weighted fair value of $53, about 92% above the current price and below the most bullish published research. The DCF supports $45, which we treat as the conservative anchor; for a high growth compounder most of the value sits in a long dated terminal that a DCF discounts heavily, which is why fwd earnings are the primary tool. The downside case requires a conjunction of events, a sharp volume deceleration, a stalled margin and an adverse regulatory recharacterisation. The base case requires only that the reported results continue to track the operating data the company is already publishing.
Other Ways to Value Figure, and the Unpriced Optionality
Our base case values Figure on its lending marketplace alone, using fwd earnings, EBT and a DCF. The base case is deliberately narrow. This section sets out the other lenses we use as cross checks, and then the sources of upside our base case assigns no value to: the unpriced options that, individually small, are collectively material.
Cross checks on the core business
Fwd P/EBIT and growth adjusted. On fwd P/EBIT, Figure (19x) sits below the 21x peer median despite far faster growth, and its roughly 0.5 PEG on near term earnings is among the lowest in the group. A multiple that compresses to 14x CY27E P/EBIT as the company compounds
i
s the simplest expression of the mispricing.
ROE. Figure is asset light and earns a 22% LTM ROE, so it is not a balance sheet lender to be valued on book value. Its 5.3x P/TBV is high for a lender but appropriate for a software margin marketplace; the ROE, double the peer median, is the right lens.
Sum of the parts. A sum of the parts reaches the same answer from the other direction: the lending marketplace plus Kiavi, on peer premium earnings and EBITDA multiples, supports roughly $44 to $58 per share; everything else, the stablecoin, the tokenization rails, and the on chain lending and equity venues, is carried at zero. The DCF, at $45, is the conservative anchor and is consistent with the comps cross check.
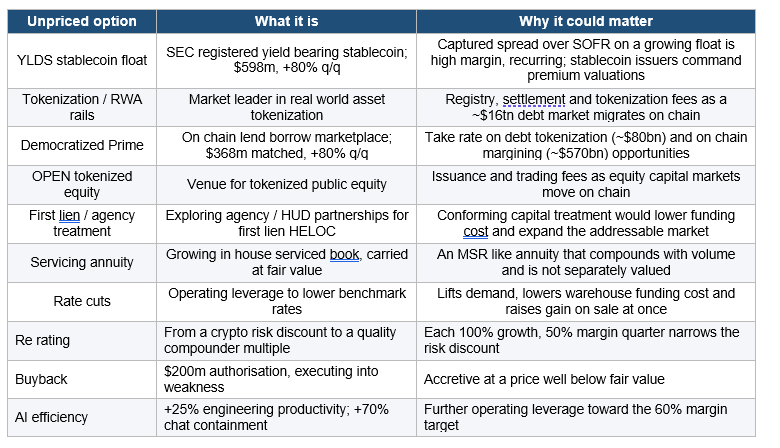
The unpriced optionality
We value each of the following at zero. None is in the $53. Each is a call option that costs little to pursue because it reuses the existing rails, and any one reaching scale is additive to a valuation that already stands on the lending marketplace alone.
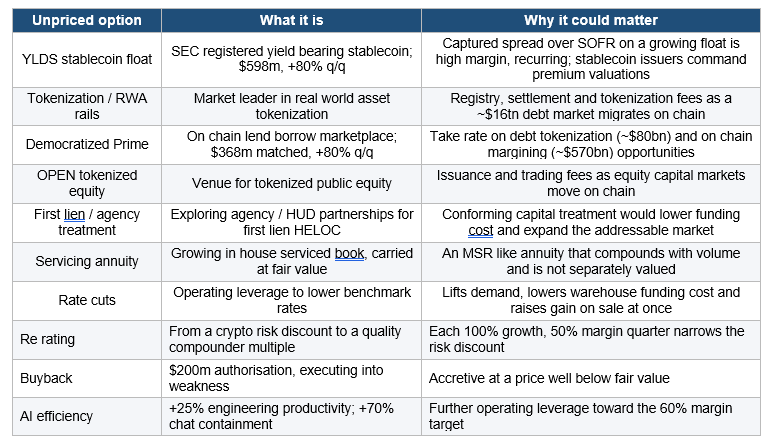
The base case stands on the lending marketplace at a defensible price; the optionality is a portfolio of free calls on the largest pools of debt, collateral and equity migrating on chain, in which Figure already holds a leading position. We do not need any of them to work for the base case; we need only that the reported results keep tracking the operating data.
Scenario Analysis
Our fair value of $53 is the base case, with Kiavi consolidated, as is the bull case. The downside is deliberately the harder test: it assumes the deal does not complete and reverts to Figure standalone, with weaker operations on top. The scenarios below frame the range by flexing the drivers that matter most: the pace of Figure Connect adoption and the marketplace volume it carries, the path of the adjusted EBITDA margin toward the 60% target, deal completion, and the multiple the market applies. At $27.86, even the bear case implies a positive return.
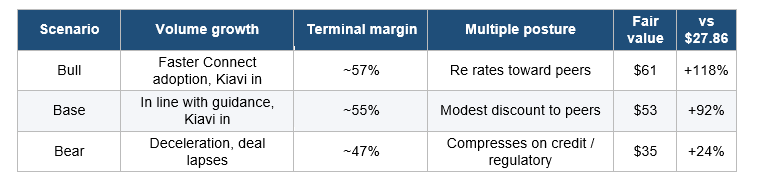
The range is asymmetric. The bear case requires marketplace volume to stall, the margin to give back ground, the Kiavi deal to fall away, and the multiple to compress on a credit or regulatory event, a conjunction, and still supports about $35, roughly 24% above the current price. The base case supports $53 and the bull case about $61, both consolidating Kiavi; removing only the deal, with operations in line, leaves Figure standalone at about $44. The current price sits below even the bear outcome.
The single variable that moves the most between cases is the terminal margin. Each percentage point of adjusted EBITDA margin is worth roughly a dollar to a dollar and a half of fair value at our multiples, which is why the company’s progress toward its 60% target, driven by the mix shift to capital light Connect and operating leverage over the software cost base, is the number we watch most closely after marketplace volume.
One honest caveat on the bear case. The $35 downside drops Kiavi and flexes the fundamentals (slower volume, a margin that gives back toward 49%) but holds the valuation multiple constant, which is why it still implies a positive return. A genuine left tail combines weaker fundamentals with a multiple derating: if an adverse open end / TILA recharacterisation stalled volume and pushed the margin into the low 40s while the market rerated Figure to a high single digit EV/EBITDA, the shares could fall to the high teens or low $20s, roughly 20% to 35% below the current price. We regard that as a low probability tail rather than the base bear, but we size the position to it: it is why the regulatory item is the risk we weight most heavily, and why we hold the name rather than press it.
Why Now
Three points stand out on timing. First, the price reflects a drawdown driven by sentiment and a single GAAP optics quarter, while the most recent reported quarter and the most recent month are the strongest in the company’s history. Second, the events the bear case relied on have already passed without the predicted damage: the lock up expired in March and the shares rose 21%, the short report was published in April and the subsequent quarter grew 92%, and the company is buying back stock into the weakness. Third, the multiple has compressed to a level the live data does not support, 11.4x EV/CY26E EBITDA and 19x earnings for a business growing volume above 100% at a 50% margin, leaving a wide gap between price and the trajectory the business is on.
The catalysts that close the gap are scheduled and frequent. Figure now reports monthly operating data and quarterly results, so the market receives a steady stream of evidence on volume, the take rate and the margin. Second quarter results, continued monthly volume prints toward the $3.8 to 4.1bn guide, further securitisation issuance at tight spreads, and progress toward the 60% margin target are each opportunities for the reported numbers to catch up to the operating reality. The risk we weight most heavily, the open end regulatory question, is a watch item with a defined path, and we size the position to it rather than avoid the name because of it.
Catalysts and What We Are Watching
The thesis does not depend on a single event; it depends on the marketplace continuing to compound while the market rerates the multiple toward the company’s growth and margin profile. Several scheduled and structural items can accelerate or challenge that path, and we track them each month and quarter.
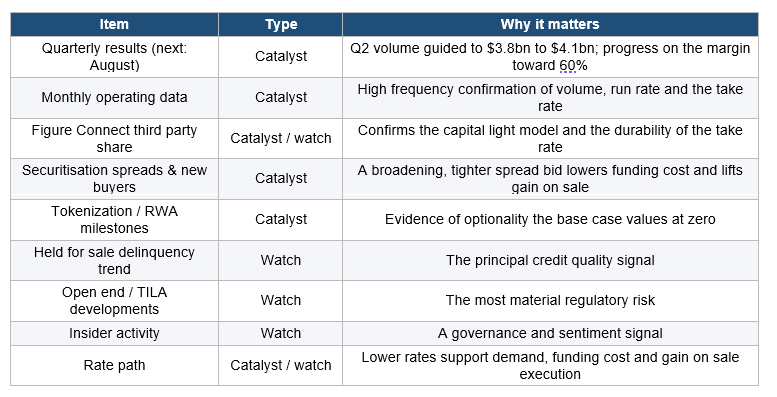
On the positive side, the most likely catalysts over the next two quarters are continued high growth prints, further evidence that Figure Connect is carrying a rising third party share, and a securitisation market that remains open and oversubscribed. On the cautionary side, the items we would act on are a sustained deterioration in delinquency, an adverse development on the open end classification, or a renewed acceleration in insider selling. None of these is our base expectation, and the balance of the calendar is, in our view, weighted toward the upside.
Conclusion
Markets frequently confuse a change in sentiment with a change in fundamentals. A high quality, fast growing business attracts a speculative following, the following fades, a single noisy quarter arrives, and the price falls further than the facts warrant. The business keeps compounding while the multiple resets.
Figure sits in that position today. It is the lowest cost originator in U.S. consumer credit, it is growing volume above 100% at a 50% margin, it generates cash and is buying back its own shares, and it trades at a discount to slower, lower margin peers and to the most bullish published research. The drawdown removed the speculative premium and then some; what remains is a profitable, cash generative business priced for a deceleration its own monthly data do not show.
We are long Figure at $27.86 against a fair value of $53, about 92% higher with Kiavi consolidated into the base case, and view the regulatory and credit items, and deal completion, as risks to size rather than reasons to avoid the position. Our downside, which assumes the deal does not complete and operations weaken, is about $35, still above the price; Figure standalone on in line operations is about $44. The data the market is waiting for are being published monthly.
Cheers,
Chiltern Capital Management